
AH-2 Energy Maneuverability
Objectives
1. Explain total energy.
2. Explain specific energy.
3. Explain specific excess power.
4. Explain aircraft maneuverability.
5. Explain Height Mach diagrams.
6. Explain energy maneuverability diagrams.
Assignment
1. Review Lesson AH-2, Energy Maneuverability, in the Advanced Handling Characteristics student guide, B/F-V5A-K-AH-SG.
2. Review Interim T-38C Procedures Manual, Sections 5.3 to 5.10.
3. Review MCMAN 11-238, Vol. 2, Chapter 3
4. Review AFI 11-2T/AT-38, Vol. 1 and Vol. 3.
5. Complete AH-2 review exercise.
Information
Total Energy
Objective 1 — Explain total energy.
1. Energy
a. Terms — Total energy, specific energy, and specific excess power
b. When you have mastered the rules and are ready to start BFM flying training you must be aware of how to gain maximum performance from your aircraft so that you can maneuver to the weapons employment zone.
c. The rest of this lesson will be devoted to examining the effect of energy on aircraft maneuverability.
d. At the end of this lesson you will be able to use MCMAN 3-1 to compare your aircraft to a bandit. You will be able to determine maneuvering parameters where you have the advantage or are at a disadvantage.
e. Total energy = kinetic energy + potential energy.
f. Total energy = mass (V2) ÷ 2 + (height × weight).
g. Total energy is a function of velocity, height, and weight.
h. Dissimilar aircraft comparison — B-52 vs. F-15. At equal airspeed and altitude the B-52 has more total energy due to its greater weight. It is not the more maneuverable aircraft. We need a more definitive comparison tool. If we mathematically modify total energy to remove weight, we determine specific energy.
Specific Energy
Objective 2 — Explain specific energy.
1. Specific Energy (ES )
a. Energy per pound of aircraft weight.
b. ES = (V2÷ 2G) + H. - where (G = 32 feet/sec per sec )
c. ES = velocity + altitude.
d. Dissimilar aircraft comparison — The B-52 energy per pound is much less than the F-15. This correctly implies that the F-15 is more maneuverable than the B-52. An F-5 and a T-38 equal velocity and equal altitude have equal ES. The F-5 is more maneuverable than the T-38 due to maneuvering flaps and different engines. ES, therefore, is still not the best maneuverability comparison tool. If we differentiate the equation for ES, then we finally have a powerful comparison tool — specific power.
Specific Excess Power
Objective 3 — Explain specific excess power.
1. Specific Excess Power (PS )
a. PS (feet per second) = (T – D) V ÷ W
b. Thrust, drag, velocity, and weight
2. Positive, negative, and zero PS
a. When thrust is greater than drag, PS is “positive.” The aircraft can climb, turn, and or accelerate.
b. When drag is greater than thrust, PS is “negative” and the aircraft will descend and or decelerate. Reducing G will decrease induced drag and increase PS. Jettisoning stores will decrease drag and weight.
c. When thrust equals drag, PS equals “zero.” The aircraft will sustain its flight condition.
d. Decreasing weight will increase PS.
e. Increasing velocity will increase PS.
f. Thrust may be increased by descending into denser air, going faster, and or power modulation.
Aircraft Maneuverability
Objective 4 — Explain aircraft maneuverability.
1. Aircraft Maneuverability
a. The ability to change the direction and or the magnitude of the velocity vector.
b. It takes energy to maneuver the aircraft.
c. How do you use energy to maneuver? What is energy?
HM / EM Diagrams
Objective 5 — Explain Height Mach and energy maneuverability diagrams.
1. HM/EM diagrams
a. Height Mach diagram
b. Specific energy
c. Maximum lift and altitude
d. Maximum energy and speed
e. Thrust and placard limits
f. Specific excess power
g. G
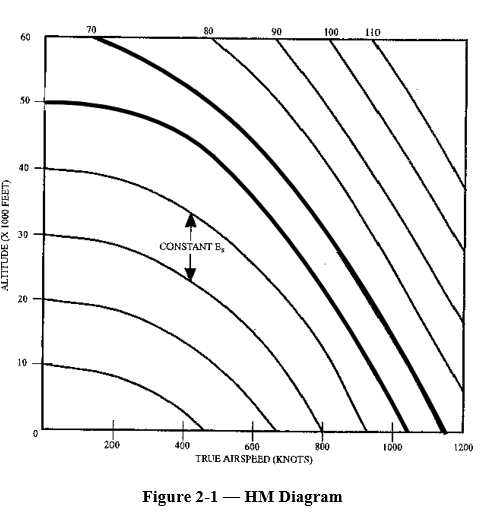
Figure 2-1 — HM Diagram
2. Height Mach diagram example
a. Math formulas are very exact. Charted data is much faster to use and accurate enough for aircrew use.
b. At the end of this lesson you will be able to read and analyze aircraft HM/EM diagrams. You will be able to compare aircraft performance and determine how to optimize advantages and minimize disadvantages.
c. ES lines only useful for comparing similar aircraft. HM diagrams are of limited usefulness (Figure 2-1).
3. HM with PS contours (Figure 2-2)
a. PS contour lines have been added to the HM diagram to assist in aircraft performance analysis.
b. ES is plotted in lines of equal energy. ES is expressed in terms of altitude in feet.
c. Point out zero PS line, maximum altitude at zero PS, and maximum airspeed at zero PS . Answer — 1, 2, 4
d. Maximum energy is not maximum airspeed. Is maximum energy important? It is if you need to gain energy rapidly to achieve a Weapons Employment Zone (WEZ) against a high and fast enemy fighter.
e. Note Ritouski climb schedule (i.e., apexes).
f. The maximum speed limit may be a thrust limit or an aircraft structural limit.
4. HM Effects
a. Increased weight, decreased thrust, increased drag and increased load factor decreases the size of the PS = zero curve.
b. 0.02 × fps = knots per second.
c. 60 × fps = feet per minute.
5. 3-G HM (Figure 2-3)
a. Note negative PS numbers outside of PS = zero.
b. Aircraft at 3 Gs and PS = –100 is decelerating or descending 100 feet per second (fps).
c. Aircraft at 3 Gs and PS = 0 is in a 3-G level turn.
d. Aircraft at 3 Gs and PS = +100 is accelerating or climbing 100 fps.
e. 0.02 × fps = knots per second.
f. 60 × fps = feet per minute.
6. 5-G HM (Figure 2-4)
a. Note how PS = zero line moved down.
b. Note how negative numbers got larger.
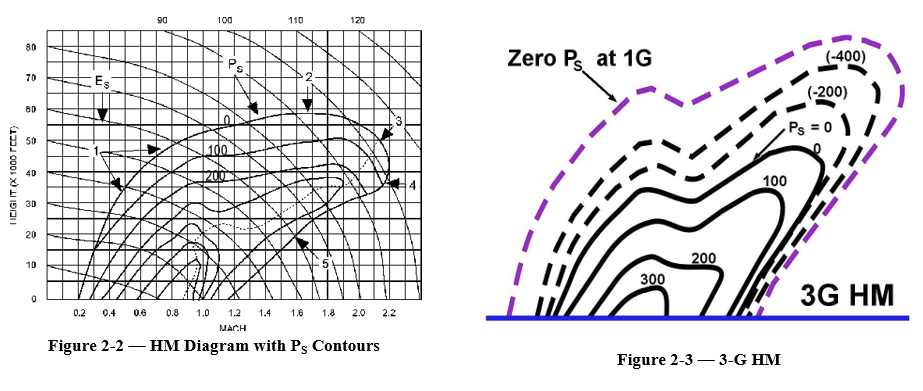 Figure 2-2 — HM Diagram with PS Contours
Figure 2-3 — 3-G HM
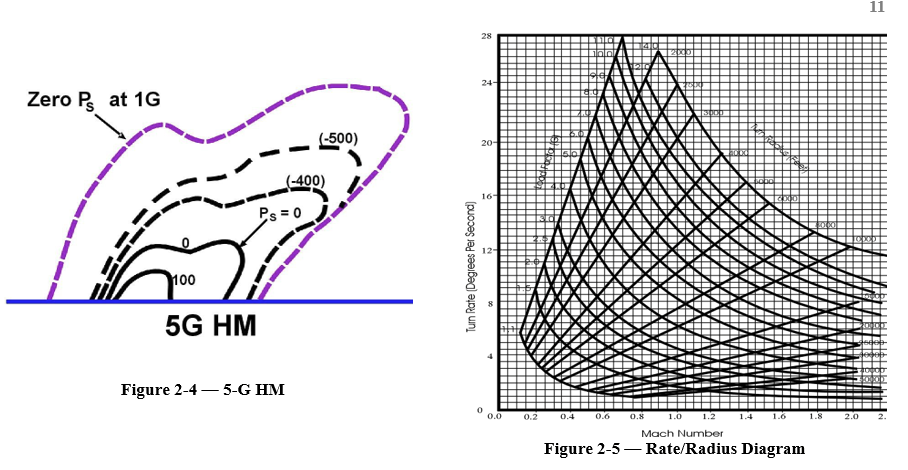
Figure 2-4 — 5-G HM
Figure 2-5 — Rate/Radius Diagram
7. Maneuver diagrams
a. HM diagrams tell us our ability to climb, turn, and accelerate. They do not tell us what our actual turning performance is. We need to develop maneuver diagrams to determine rate and radius of turns.
8. Rate of turn (rate)
a. Rate is degrees per second = KG ÷ V (KTAS)
b. K is a conversion constant. We will ignore K and look at the affects of aircraft G-load (G) and velocity (V).
c. As G increases, rate of turn increases. As G decreases, rate of turn decreases (Figure 2-5).
d. As V increases, rate decreases. As V decreases, rate increases (Figure 2-5).
9. Radius of turn
a. Radius of turn in feet = V2 (KTAS) ÷ KG.
b. Radius of turn increases or decreases directly as the square of the velocity (i.e., big radius changes for small airspeed changes).
c. As G increases, radius decreases. As G decreases, radius increases (Figure 2-5).
10. EM Diagrams
Plot rate, radius, and energy (Figure 2-6)
a. What is the rate, radius, and PS of a T-38 at 400 KCAS and 6 Gs? Answer — 13° per second, 3,600 feet, and – 600 fps (negative PS)
b. What is the rate, radius, and PS of a T-38 at 400 KCAS and 5 Gs? Answer — 11° per second, 4,500 feet, and – 100 fps (negative PS)
11. Corner velocity Minimum velocity at which maximum G can be attained.
a. Yields maximum rate of turn.
b. Yields minimum turn radius.
12. Sustained corner velocity
a. The speed at which maximum sustained rate of turn can be achieved.
b. Maximum G on the PS = zero line.
13. T-38 Energy Maneuverability Diagram (Figure 2-6)
a. Point out — maximum lift, maximum G, placard limit, G scale, rate scale, radius scale, and airspeed scale.
b. Valid only for level turns under the specified steady state conditions. WARNING — Maximum lift and G can be exceeded during a dynamic overshoot (i.e., rapid full aft stick).
c. Locate corner — Follow maximum lift to maximum G, read down to airspeed. Note that maximum G is a function of aircraft weight (e.g., at 3,000 pounds fuel).
d. Locate sustained corner — Follow PS zero line to highest rate, read down to velocity.
e. Note — High negative PS at corner velocity.
f. Note — Maximum G available at 350 KCAS = 5.5 G.
g. Note — Rapid radius increase with airspeed increase.
h. Note — Below corner, radius does not change greatly on max lift line.
i. Note — Below corner, rate drops off rapidly.
14. EM Comparison Diagrams
a. MCMAN 3-1 displays comparison data in classified EM diagrams.
b. Comparison diagrams are useful for evaluating various fighter aircraft strengths and weaknesses. Compare turn rates and turn radii, instantaneous and sustained corner speeds, bleed rates (PS), and aircraft lift, G, and speed limitations. Look for exclusive areas that may be utilized or exploited in air combat.
15. EM limitations
a. Depth of knowledge and understanding — Extensive threat study and analysis is required to develop offensive and defensive tactics.
b. Identification (ID) is required to execute the proper offensive or defensive plan.
c. Game plan — Your initial offensive or defensive maneuver will be based on the tactical situation and the concepts of energy maneuverability.
d. Tactical trade off — Nose position vs. energy. Moving the nose to kill or deny shots requires energy. Are you willing to give up energy? Do you have energy to give up?
Summary
1. Height Mach diagrams — Understand concepts of energy, altitude, and weight.
2. Energy maneuverability — Understand the relationship of PS , rate, radius, and airspeed.
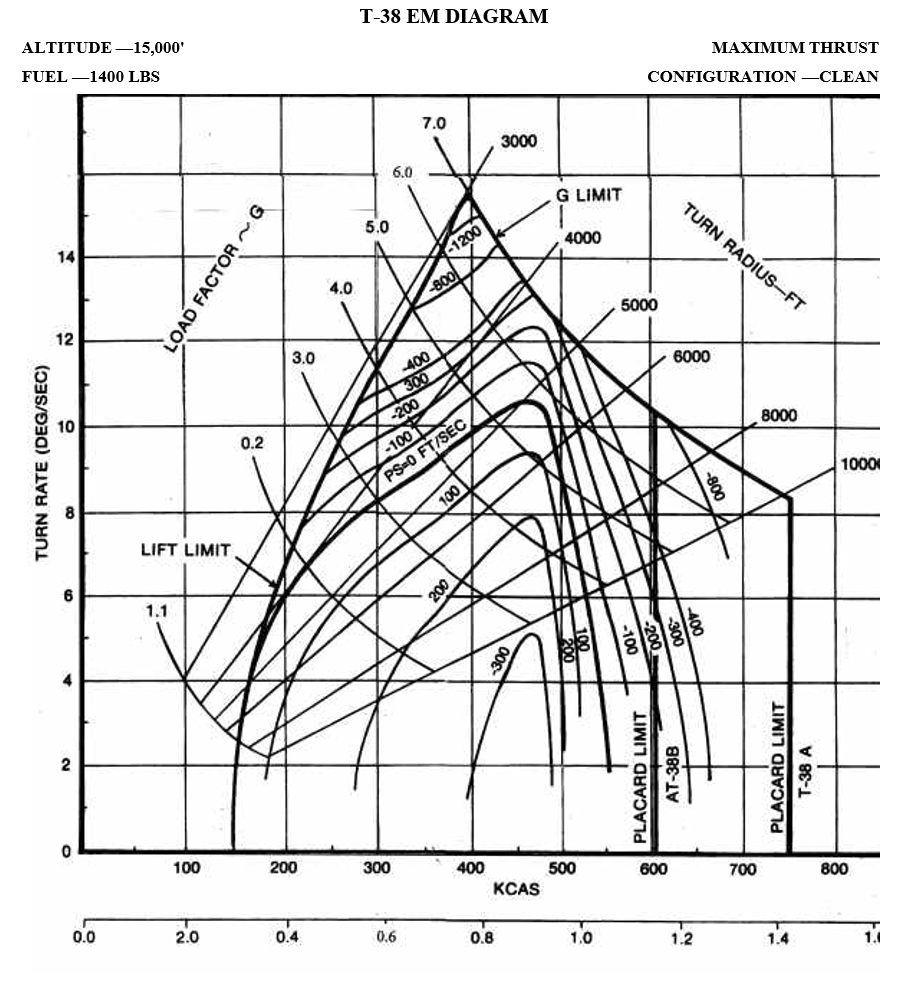
Figure 2-6 — T-38 EM Diagram
Review Exercise AH-2
Complete the following review exercise by choosing the correct responses. Answers are in Attachment 1.
1. Total Energy = energy + energy.
2. Specific Energy is a function of
a. weight/drag + velocity
b. velocity + altitude
c. total power/total weight × velocity
3. When drag is greater than thrust, PS is .
a. zero
b. positive
c. negative
4. When thrust is greater than drag, PS is .
a. zero
b. positive
c. negative
5. If you must descend to maintain 400 KCAS, then PS is .
a. zero
b. positive
c. negative
Refer to Figure 2-6 for the following questions.
6. What is the aircraft turn radius and turn rate at 6 Gs and 400 KCAS? / .
7. What is the aircraft turn radius and turn rate at 5 Gs and 400 KCAS? / .
8. Corner velocity occurs at KCAS.
9. PS at 390 KCAS and 6 Gs is .
No comments to display
No comments to display