
4.4 - Power and Energy Management.
4.4 Power and Energy Management.
Power affects airspeed and therefore turn radius and rate. Power is also used to control energy. Energy provides the potential to maneuver. Nonoptimal energy levels (usually expressed in airspeed) can result in degraded turn performance, reduced time in weapons parameters, or greater exposure to threat weapons. Expend available energy only as required for offensive advantage (that is, kill the Bandit), defensive necessity (that is, deny Bandit WEZ/CZ), or merge preparation. Otherwise, strive to maintain or gain energy as the situation allows.
4.4.1 Energy Maneuverability (EM) Diagram (Figure 4.9).
In BFM with all other variables equal, the more maneuverable aircraft usually has a better chance of winning. All BFM involves turning, and generally the tighter turning aircraft (radius) that can turn the greatest number of degrees over a specified time period (rate) has the advantage. Engineers have translated the data for use in EM diagrams which depict an aircraft’s rate of turn, turn radius, and energy bleed rate at a given weight, throttle setting, altitude, airspeed and G- loading. By comparing the EM diagrams, it can be determined who has the advantage, and where that advantage lies in terms of altitude and velocity. Figure 4.9 shows the diagram for a T-38 at gross weight = 10,155 pounds and ALT = 15,000 feet and MAX afterburner. There are some important points on the EM diagram to be familiar with. Along the bottom axis is the airspeed. G is depicted by the blue lines. The placard G limit is 7.0 Gs. The curved line (labeled MAX LIFT) that runs down the left side of the diagram is the lift limit line. The area bounded by the max lift limit, placard G limit, and placard airspeed limit is the flight envelope. To read the diagram, enter from the bottom with airspeed and follow it up to one of the G-load lines that run from the upper left to the lower right. At the intersection of G and airspeed, reference the rate, shown on the left, and parallel to the radius lines up and to the right for turn radius.
4.4.1.1 Ps.
Inside the flight envelope, every point defined by an airspeed and G loading has an associated energy gain or loss. They are measured by negative or positive feet per second, are numerated in hundreds of feet per second, and represent a measure of the energy bleed or gain rate. If the energy bleed rate is negative, it means that to sustain the current G load and airspeed, the aircraft must descend (change potential to kinetic energy) at the depicted rate. These lines are often referred to as excess power or Ps lines.
4.4.1.2 Turn Rate.
Along the left, vertical axis is the turn rate. Rate is measured in degrees per second and graduated every 2. A turn rate of 12 per second means the nose will transit through 12 of turn in 1 second at the G load and airspeed depicted. If in a horizontal turn, this would mean 12 of heading change. If pulling in the pure vertical it would mean 12 of vertical attitude change. Note that, up to approximately 380 knots, the rate increases with airspeed.
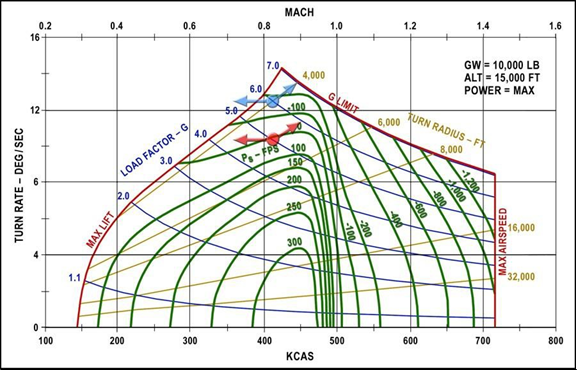
Figure 4.9. T-38 EM Diagram.
4.4.1.3 Radius.
Turn radius is depicted by the straight lines that run from the lower left to the upper right of the diagram. They are measured in thousands of feet and graduated every 1,000 feet. Note that, assuming a constant airspeed, the radius decreases as G is applied until the aircraft reaches either the maximum lift or the maximum G available.
4.4.1.4 Corner Velocity (Figure 4.10).
The very peak of the diagram is the instantaneous corner velocity. This is where maximum allowable G intersects with the lift limit line and depicts the slowest airspeed at maximum G can be applied. Instantaneous corner velocity can be approximated by referencing the G line and finding the intersection with the lift limit line. (Reference the red-dashed circle in Figure 4.10). Instantaneous turn capability comes at a cost, however, in the form of negative Ps.
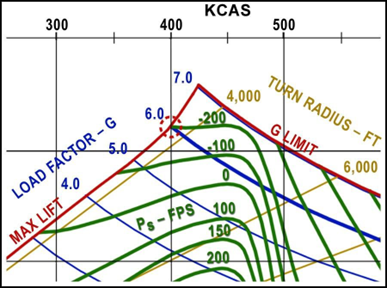
Figure 4.10. Corner Velocity.
4.4.1.5 Comparing EM Diagrams.
When comparing fighter performance, overlaying the EM diagrams will determine areas of strength and weakness for both aircraft. This provides a good idea of the flight regime to engage the adversary. For instance, if one aircraft is superior at higher altitudes, that pilot should try to keep the fight high. If the other aircraft has a superior sustained rate, the pilot would strive to fight a rate fight. At IFF, the adversary is also flying the T-38C, but by restricting use of throttle and/or G, advantages are available to the unrestricted aircraft in the form of increased rate and decreased radius and less bleed rate during the turn (reference Figure 4.9 to see the red and blue circles). A typical advantage enjoyed during an IFF engagement is approximately 2°/second and about 800 feet in radius. 2°/second over 360° of turn (about 28 seconds) equals 56° of advantage.
No comments to display
No comments to display